Mediation analysis with nuisance variables.
Mediation analysis is a simple idea that is easy to do, but an absolute minefield to interpret correctly. The principal is easy – perhaps one explanatory variable correlates with the dependent variable by mediating (effecting) an other explanatory variable. So say you find out that bullet wounds correlates with death and blood loss correlates with death, you could do a mediation analysis to see if bullet wounds correlates with death by affecting blood loss – and you would find that it does (sorry about the gruesome example). One absolute NO NO for mediation analyses is if the direction of causation could be the other way. i.e. the dependent variable causes the explanatory variables. All mediation analyses breaks down at this point, so don’t do it (cough – like this paper did – https://pubmed.ncbi.nlm.nih.gov/29567761/ – cough). For example if you modelled bullet wounds as the dependent variables and explained it with death and blood loss as a mediation factor, you would find that death causes bullet wounds directly and indirectly through blood loss. This obviously doesn’t make sense (this is different to just correlation analyses that doesn’t care about the direction of causality).
In this example we are seeing whether or not the age of a patient correlates with inflammation through the variable bacterial count. The idea being that being old not only directly causes inflammation, but perhaps makes you more susceptible to bacteria growth, leading to larger numbers of bacteria in your blood and this leads to more inflammation. Now to make this even more complicated (just because that is how data is) what if you wanted to get rid of some nuisance variables first, before looking at your explanatory variables of interest? Wow, OK, here we go.
First Load the data and packages. Make sure the data makes sense (you should always do this), e.g. are the numerical variables numerical?
#Load package
library(MASS)
library("mediation")
#Load data
dat<- read.table(url("https://jackauty.com/wp-content/uploads/2020/05/Stepwise-regression-data.txt"),header=T)

#Check data, make sure it makes sense
str(dat)

'data.frame': 100 obs. of 8 variables:
 $ Inflammation : num 4.4 1218.07 5.32 3072.58 108.86 ...
 $ Age : num 7.16 8.88 3.23 7.91 7.98 2.93 9.12 9.41 7.71 2.91 ...
 $ Sex : Factor w/ 2 levels "F","M": 2 1 1 1 2 1 1 2 1 1 ...
 $ Blood.pressure : num 151 145 104 156 143 159 114 140 149 114 ...
 $ Infection : Factor w/ 2 levels "No","Yes": 1 2 1 2 1 1 1 1 2 1 ...
 $ Bacterial.count : num 75 5718 27 4439 224 ...
Next, check if the dependent variable is normally distributed. It doesn’t have to be, but things will go smoother if it is. In this example the dependent variable distribution was improved by a square-root transformation. So I created a new transformed variable.
#Check dependent variable, ideally it's normally distributed. Transform if need hist(dat$Inflammation, breaks=6)hist(sqrt(dat$Inflammation), breaks=6)
#Square root looks better, so let's create a variable to use in our model dat$Inflammation.transformed<-sqrt(dat$Inflammation)
Next let’s build a model with the nuisance variables (Sex and Blood Pressure) and extract the standardized residuals into a new column of our dataframe. Residuals (Standardized) are the left over variation after the accounting for the nuisance variables. This residual variation will then hopefully be mostly explained by our variables of interest. Check the assumptions and transform if needed.
#Set up adjusted model adjusted.model<-lm(Inflammation.transformed ~ Sex*Blood.pressure, data = dat) summary(adjusted.model) #Check Assumptions par(mfrow=c(2,2)) plot(adjusted.model)#Extract the standardized residuals and turn them into a column in your data dat$residuals<-stdres(adjusted.model) #Check your data dat[1:20,]
Next let’s build our base models with our two explanatory variables. First with our primary explanatory variable (Age), then with our primary explanatory variable and our mediator variable (Bacterial count). Then check your assumptions. Here it looks like we need to transform our explanatory variable of bacterial count. Often things like bacterial count need a log transformation and it worked!
#Build base models fit.direct.model<-lm(residuals~Age, data=dat) fit.mediator.variable.model<-lm(residuals~Age+Bacterial.count, data=dat) summary(fit.direct.model) summary(fit.mediator.variable.model) #Assumption check par(mfrow=c(2,2)) plot(fit.direct.model) plot(fit.mediator.variable.model)#Top left you can clearly see the relationship isn't linear. #Transform predicting variable dat$log.bacterial.count<-log(dat$Bacterial.count) fit.direct.model<-lm(residuals~Age, data=dat) fit.mediator.variable.model<-lm(residuals~Age + log.bacterial.count, data=dat) summary(fit.direct.model) summary(fit.mediator.variable.model) #Assumption check par(mfrow=c(2,2)) plot(fit.direct.model) plot(fit.mediator.variable.model)
#NNNIIIICCCEEEEE
Now we need to centre the variables. This is important as coefficients are only comparable when the explanatory variables are centred. In this example you might get a small coefficient for bacterial counts, because bacterial counts are in the millions and you might get a large coefficient for Age because that maxes out at 100 (ish). But if you centre both variables (turning them into Z scores), then they become more comparable as they’re on the same scale.
#Centering variables
dat$log.bact.centred<-(dat$log.bacterial.count-mean(dat$log.bacterial.count))/sd(dat$log.bacterial.count)
dat$Age.centred<-(dat$Age-mean(dat$Age))/sd(dat$Age)
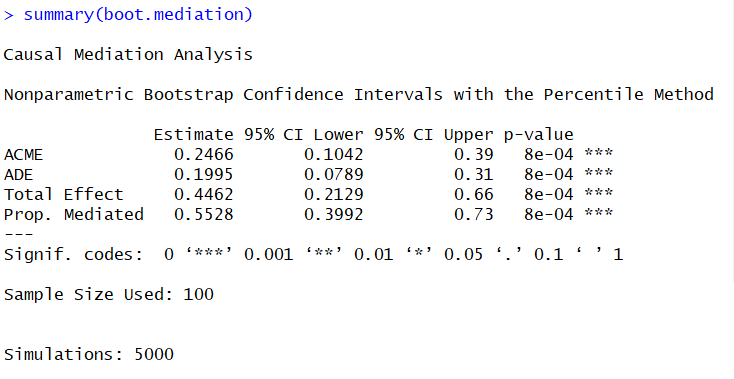
Next we get to run our mediation analysis and boomtown we get a significant effect of Age on inflammation and a mediation effect of Age on inflammation through the the effect of age on bacterial count. We ran it again with a boot-strap method that is more robust and less susceptible to a lack of normality in the residuals and we got the same result. Our results show that more than 50% of the effect of Age on inflammation can be explained by bacterial count. This suggests that being elderly increases the risk of a bacterial infection and this explains a good proportion of why the elderly have more inflammation (note this data is made up).
#Running models with centred variables fit.direct.model.centred<-lm(residuals~Age.centred, data=dat) fit.mediator.variable.model.centred<-lm(residuals~Age.centred + log.bact.centred, data=dat) #Run mediation analysis mediation<-mediate(fit.direct.model.centred, fit.mediator.variable.model.centred, treat="Age.centred", mediator = "log.bact.centred") summary(mediation)#Bootsrap method for extra robustness boot.mediation<-mediate(fit.direct.model.centred, fit.mediator.variable.model.centred, treat="Age.centred", mediator = "log.bact.centred", boot=T, sims=5000) summary(boot.mediation)

